We all took a lot of math classes over the years. Anyone remember their algebra or calculus? Not me. I will say, the basics come in handy all the time, especially when we are doing a market orientation for buyers and sellers. The math is pretty simple. It goes like this:
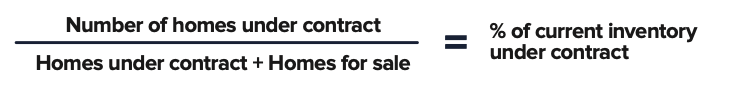
Over the years we have found that whenever the percentage is 40% or higher, that is a good indicator we are in a sellers’ market. I’ve seen this ratio get as high as 60 – 70%. That typically means that multiple offers and bidding wars are on the way. When the ratio is 30% or lower, that indicates that the market is softening and there is a good opportunity for buyers to negotiate.
Curious how the market is doing near you? No worries… we did the math for you
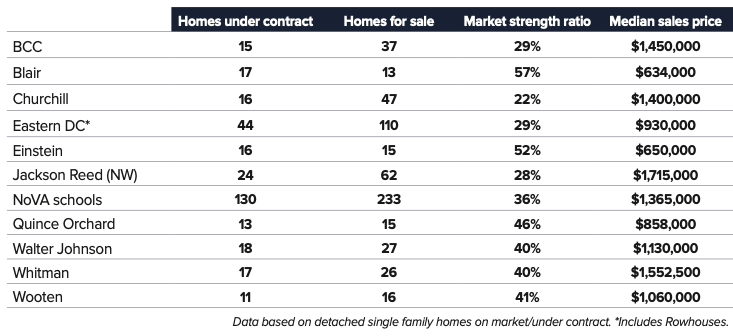
Ron’s take: Some of the ratios are weaker than I would have expected. It’s too early to tell if this is from a slower than usual August, a normal season fluctuation, or a new trend. The same thing happened last fall and the market rebounded quickly in 2023.
If you would like to monitor the real-time market strength in your Zip Code, you can sign up to get free monthly updates simply by following the links behind these QR codes